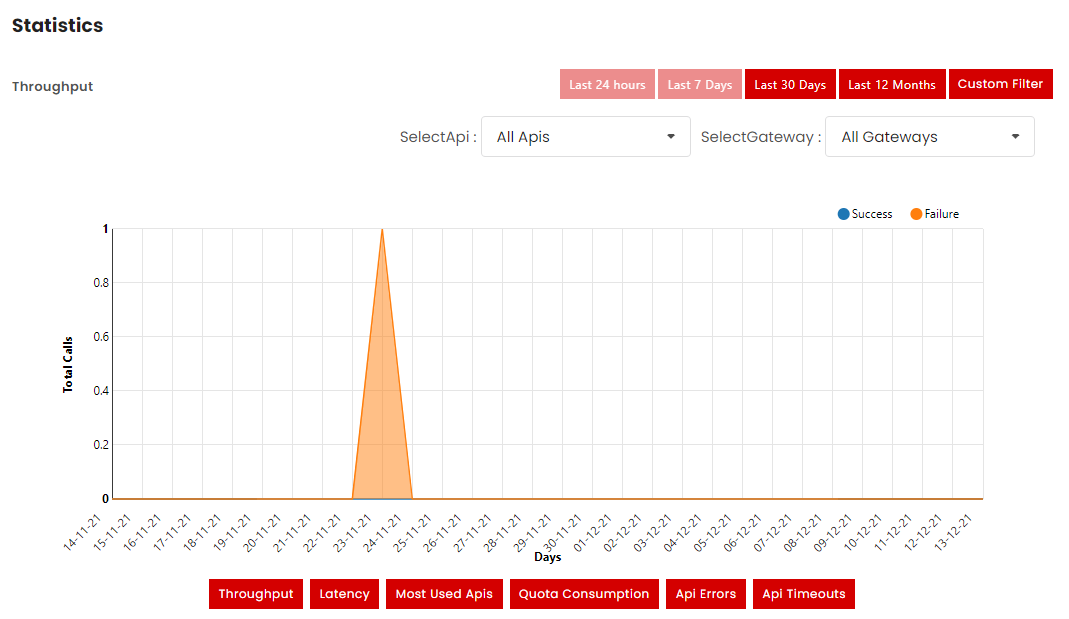
Once the Developer apps go live and start invoking APIs, the API Gateway begins monitoring and collecting data for reporting and analytics. The Statistics also presents real-time streamed analytical information.
Studying the statistical information can provide valuable insights into the popularity and Usage of APIs. Information about how the APIs will be used in the future, and other API-related data and traffic flow enables you to take important business decisions that helps improve profitability of APIs.
Understanding statistical information answers some important questions, such as:
Who is consuming which APIs?
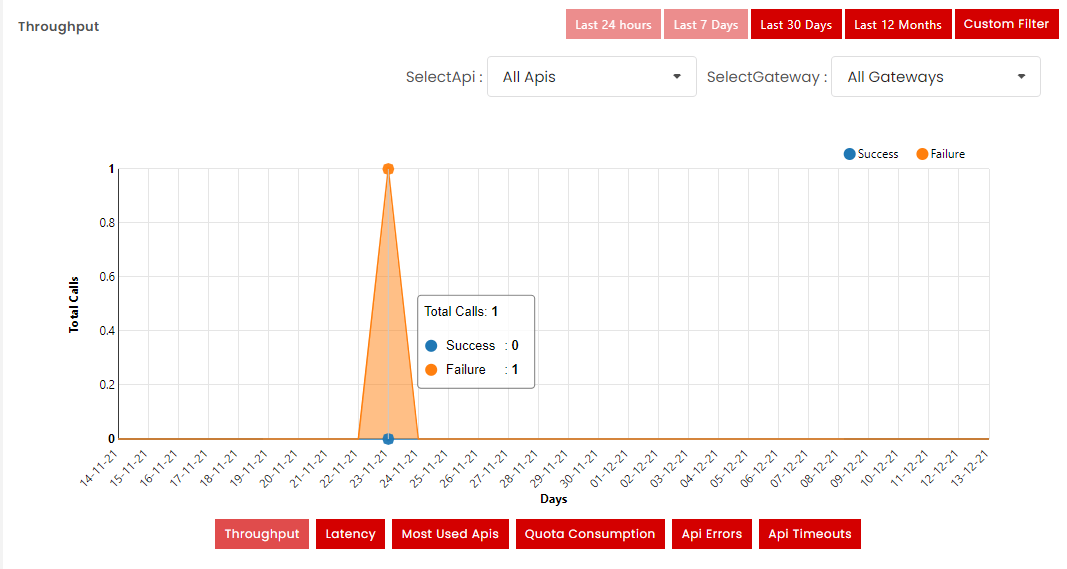
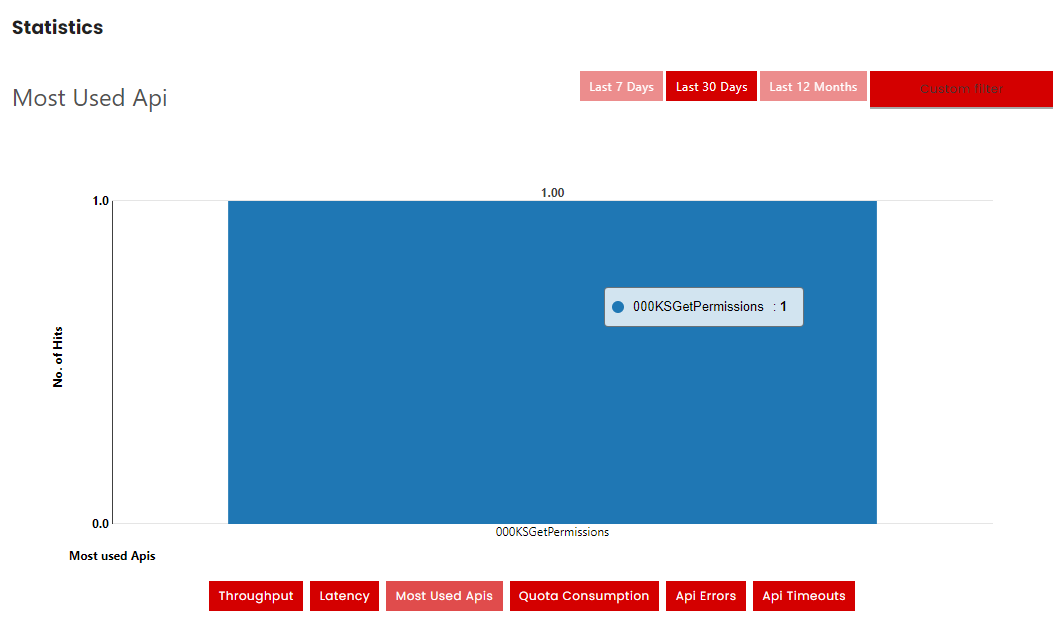
What is the traffic generated by top APIs?
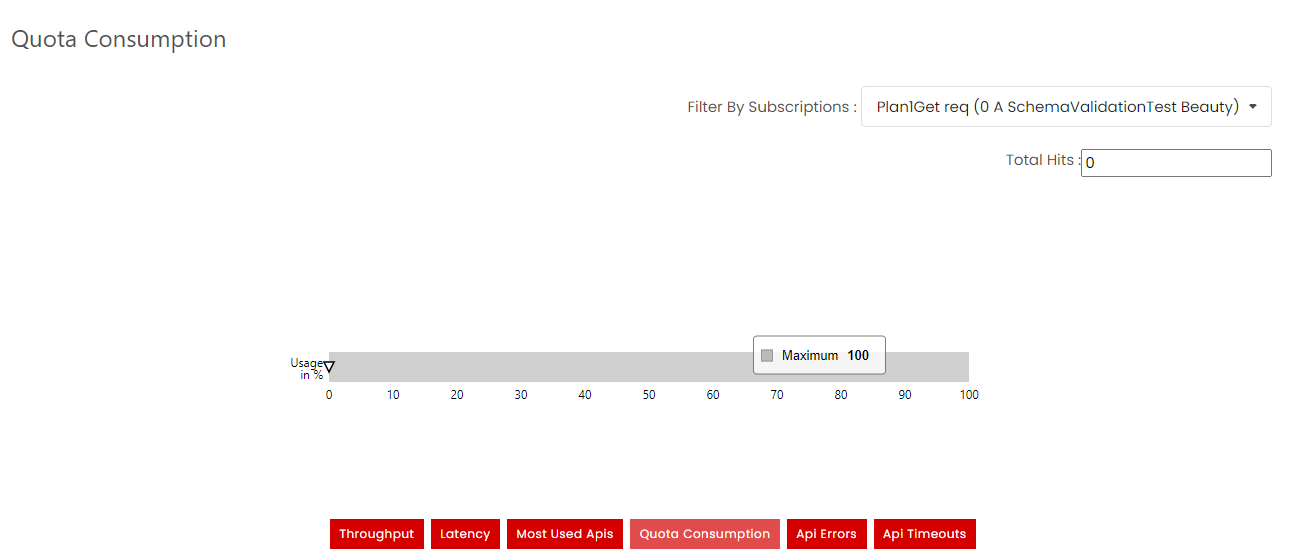
Which APIs brought in the most revenue?
Which apps generate the most API traffic?
Was there any API downtime due to errors and timeouts?
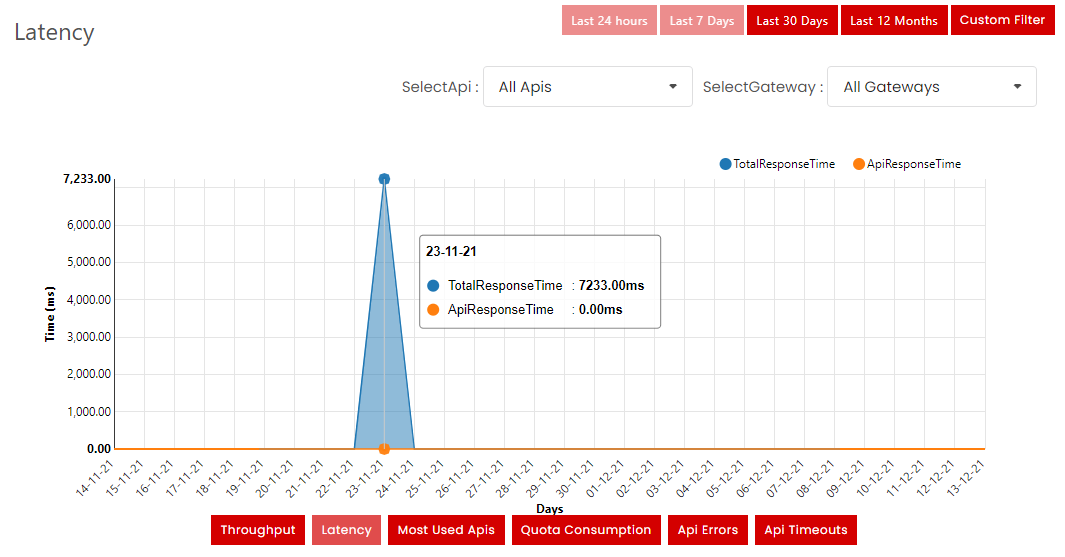
Gateway Response and Backend Response Time
Consider the scenario
If a user is requesting to gateway at time T1, Gateway will pass the request to Backend at time T2. Backend will process the request and pass it to Gateway at time T3 and gateway will pass it to user at time T4.
So
Total Response Time to User is T4-T1
Back End Response Time is T3-T2
Gateway Response Time is Total Response Time - Backend Response time i.e (T4-T1)-(T3-T2)
To view Statistics:
In the main Navigation menu, click Statistics. The Statistics screen displays.
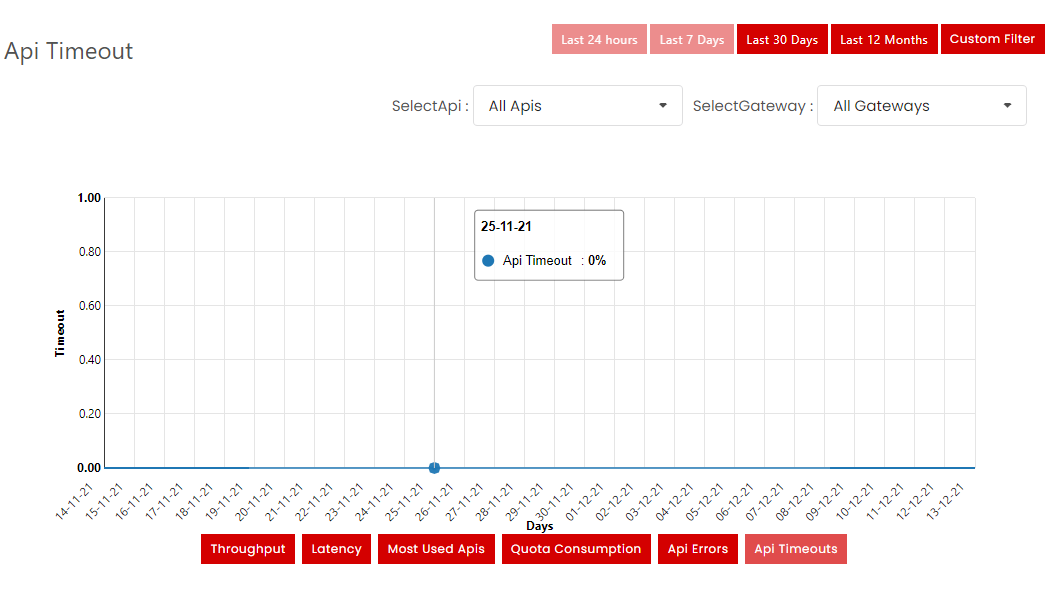
It is the data of how many times API failed to respond in a given time. It is calculated for hours or days for selected APIs and Gateways. The graph is plotted against days Vs Timeout.
Live Data
Last 24 hours
Last 7 days
Last 30 days
Last 12 months
Custom filter
In custom filter user must provide start date and end date and submit, for entered value result will appear.