Once the Developer apps go live and start invoking APIs, the API Gateway begins monitoring and collecting data for reporting and analytics. The Statistics also presents real-time streamed analytical information.
Studying the statistical information can provide valuable insights into the popularity and Usage of APIs. Information about how the APIs will be used in the future, and other API-related data and traffic flow enables you to take important business decisions that helps improve profitability of APIs.
Understanding statistical information answers some important questions, such as:
Who is consuming which APIs?
What is the traffic generated by top APIs?
Which APIs brought in the most revenue?
Which apps generate the most API traffic?
Was there any API downtime due to errors and timeouts?
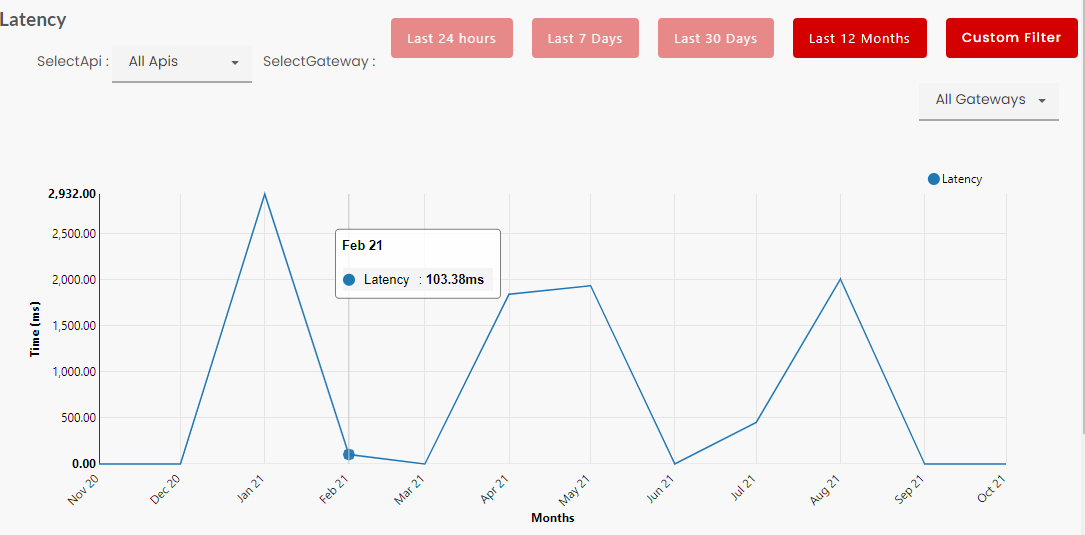
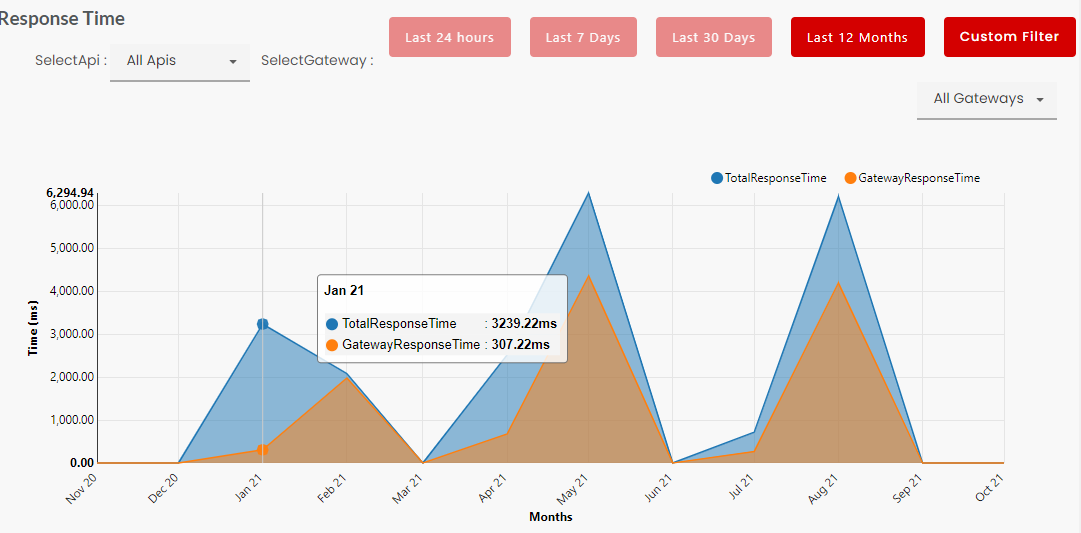
It is the Average response time the APIs receive at different stages of the call.
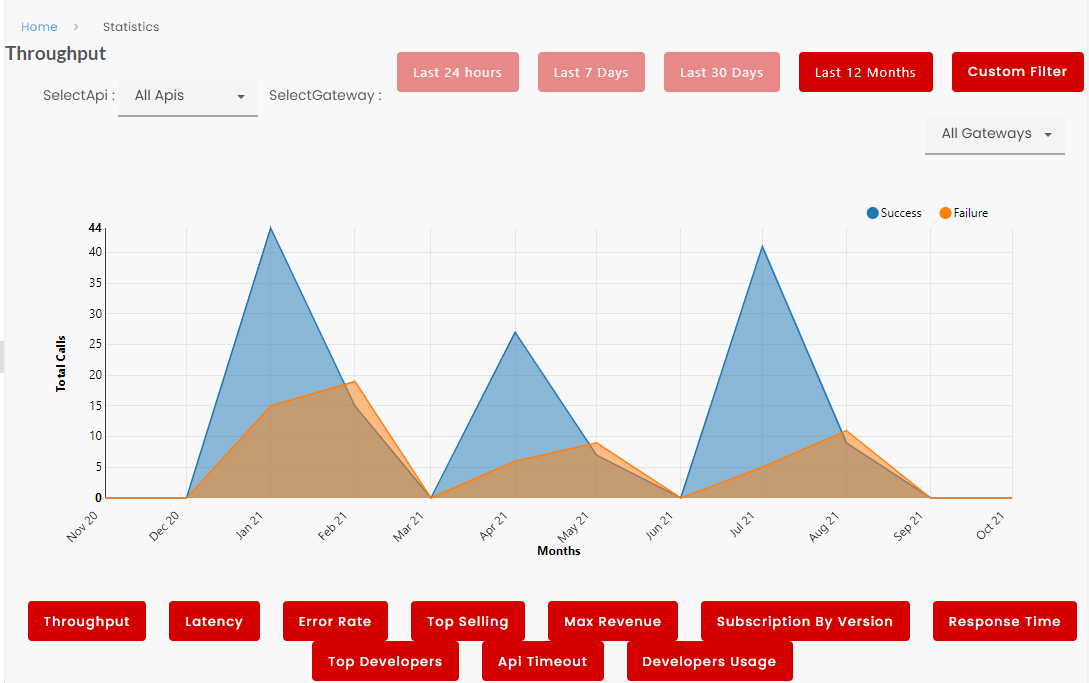
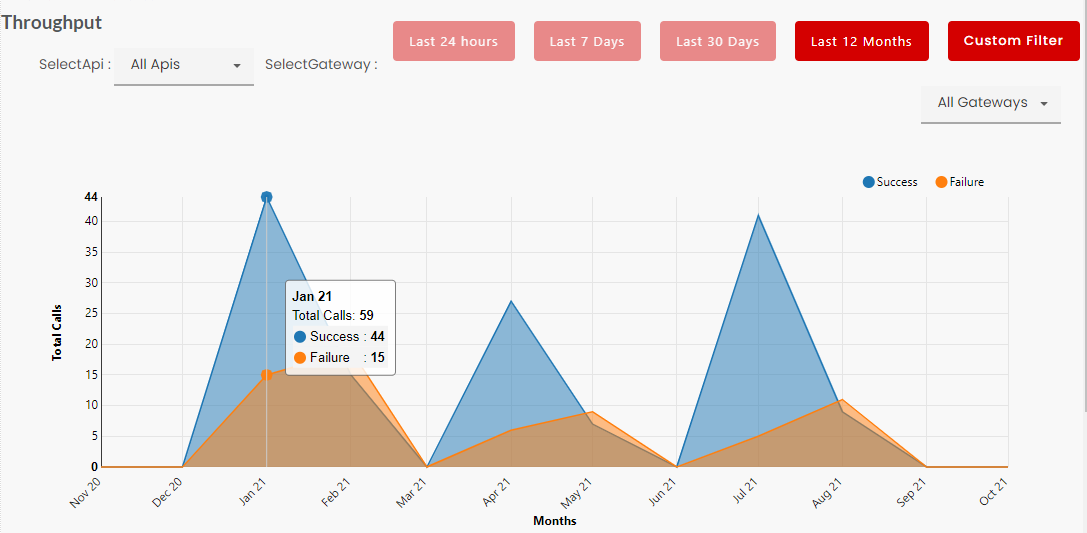
It is calculated for hours or days for selected APIs and Gateways. The graph is plotted against Time(ms) Vs Hours. It is a line chart.
Last 24 hours
Last 7 days
Last 30 days
Last 12 months
Custom filter
In custom filter user must provide start date and end date and submit, for entered value result will appear.
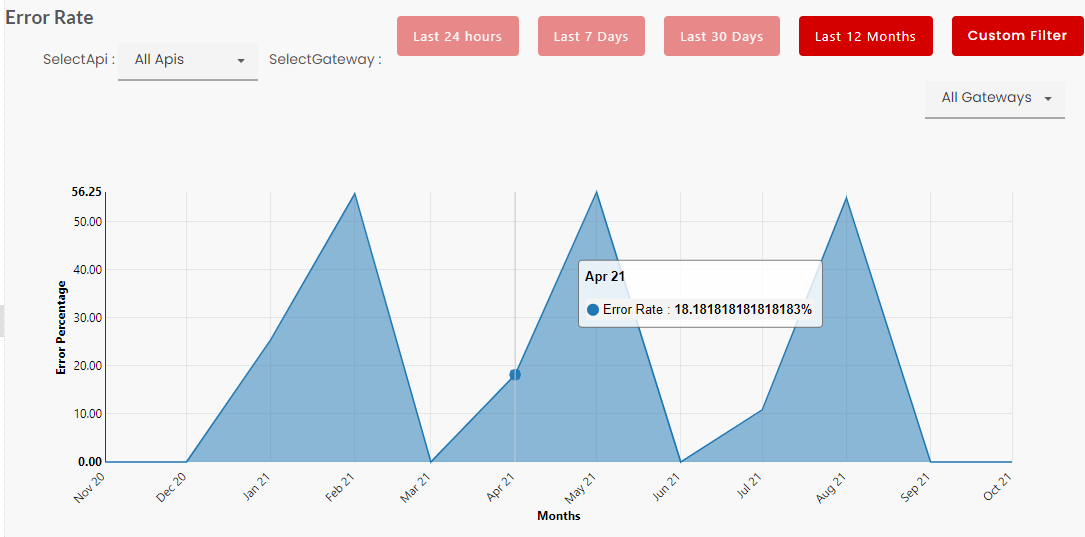
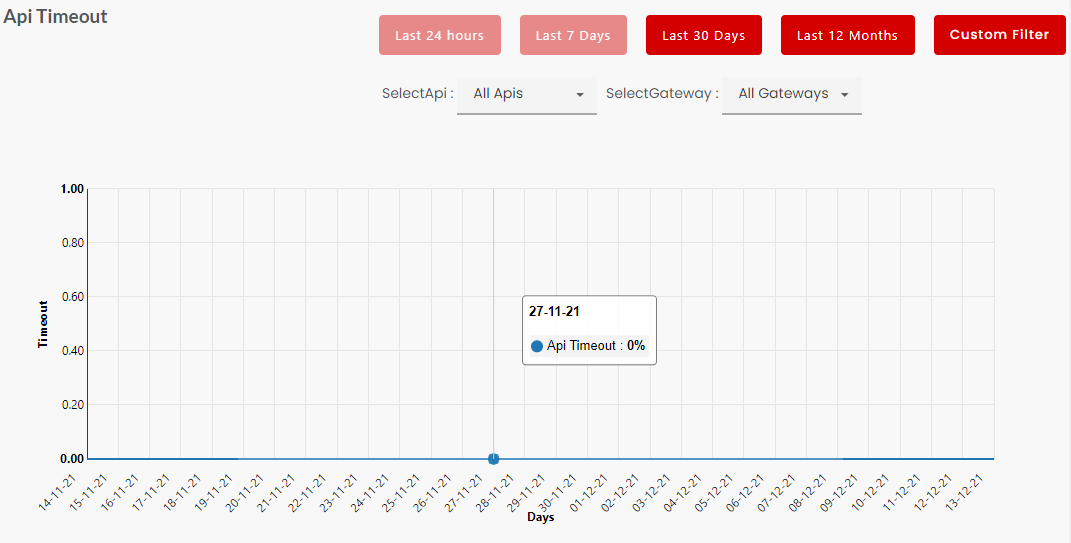
It is the rate of timeouts during a time period out of the total requests processed. It will generally Zero hence it will display as No Data to Display.
It is calculated for hours or days for selected APIs and Gateways. Last 30 days
Last 24 hours
Last 7 days
Last 30 days
Last 12 months
Custom filter
In custom filter user must provide start date and end date and submit, for entered value result will appear.
Gateway Response and Backend Response Time
Consider the scenario
If a user is requesting to gateway at time T1 and gateway will pass the request to Backend at time T2, backend will process the request and pass to gateway at time T3 and gateway will pass to user at time T4.
So
Total Response Time to User is T4-T1
Back End Response Time is T3-T2
Gateway Response Time is Total Response Time- Backend Response time which is (T4-T1)-(T3-T2)
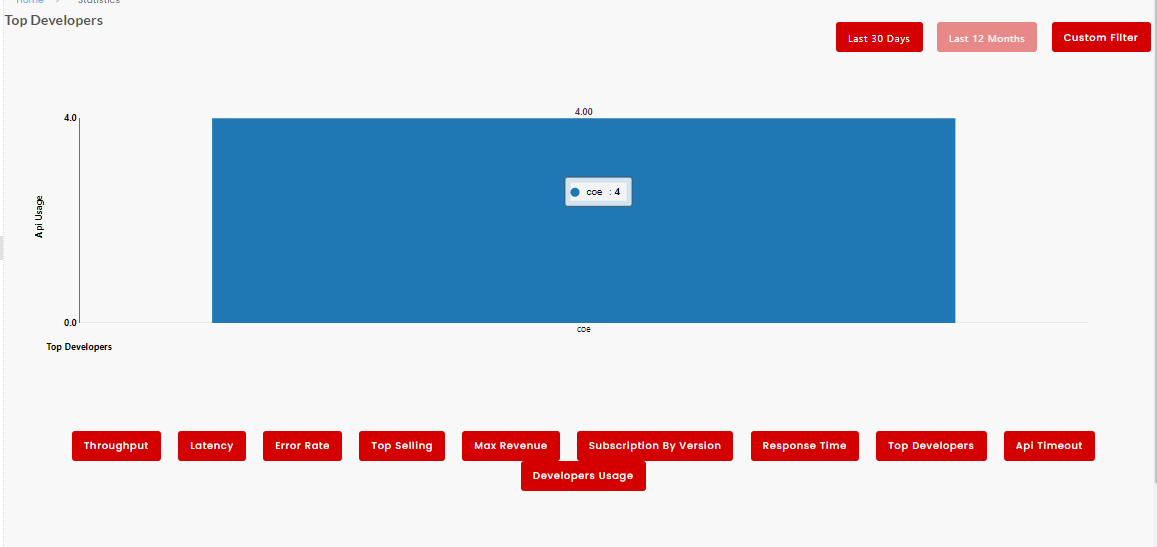
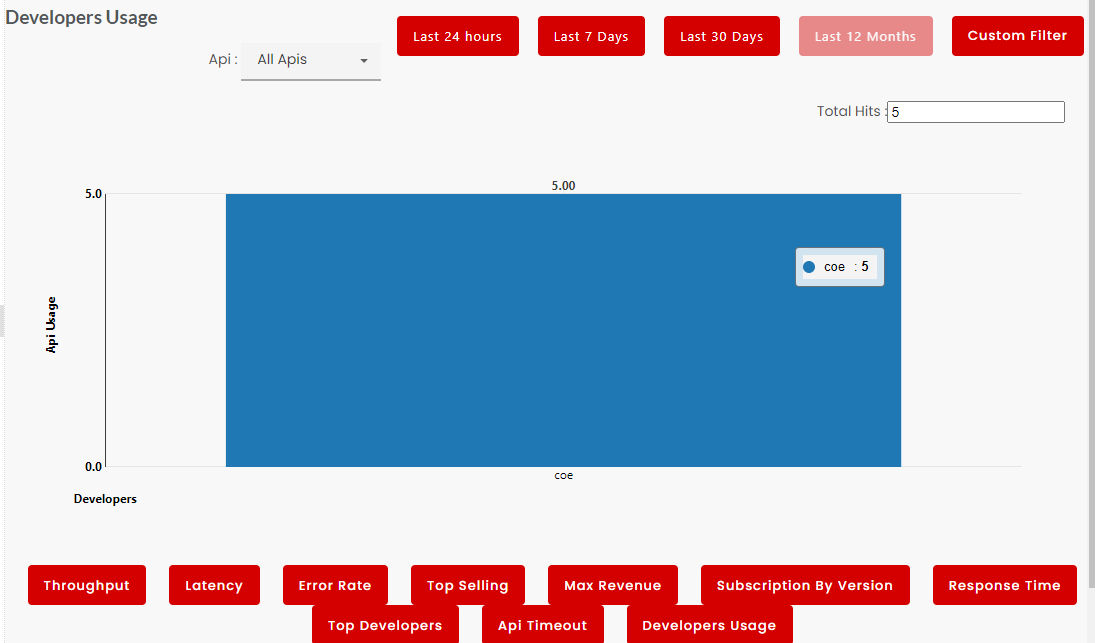
Click an icon to view related statistics.
Filter Statistical data
You can filter API data for Throughput, Latency, Error Rate, Response Time, API Timeout and Developers Usage. Filtering data allows you to view statistical report for:
All APIs
An individual API
All Gateways
An individual Gateway
Additionally, you can use a custom filter option on all screens to display data for a selected period.
Note
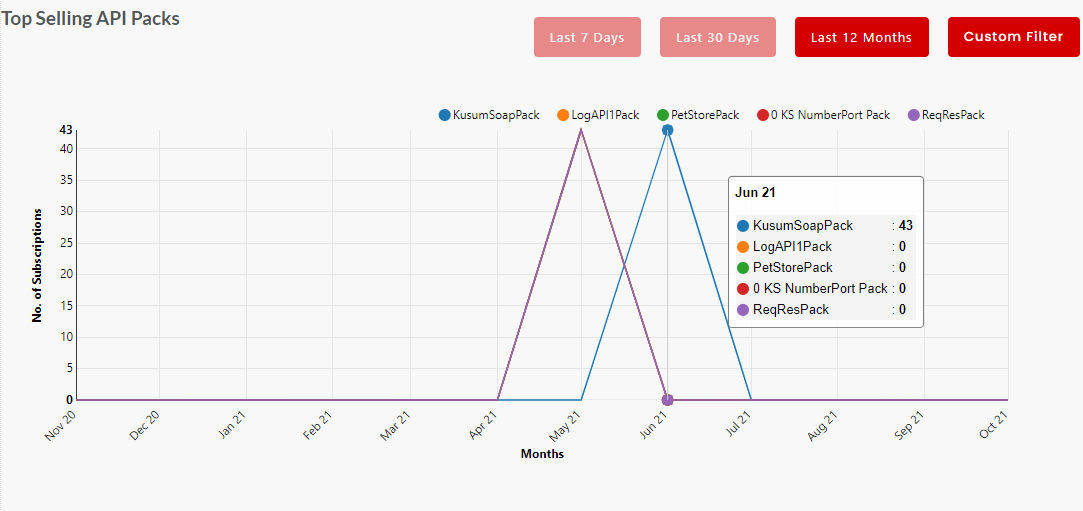
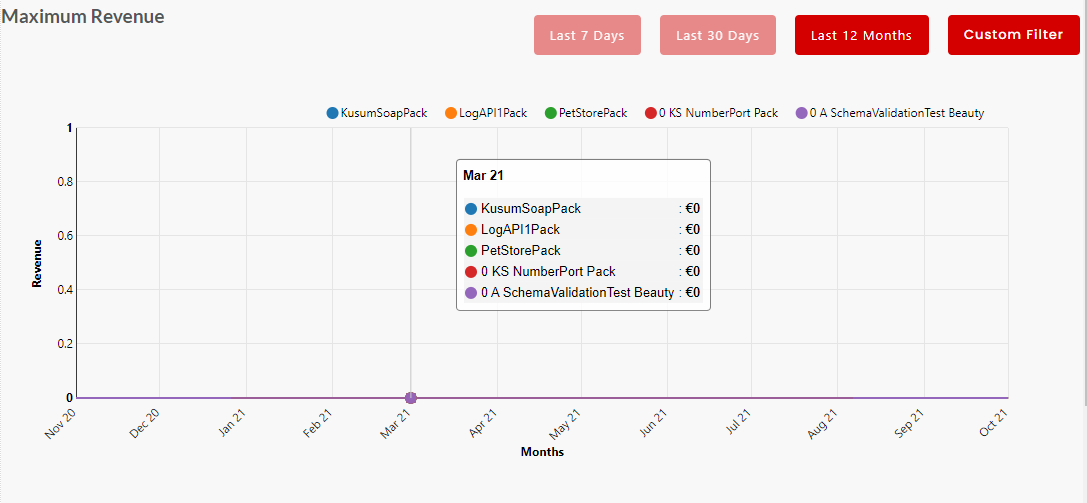
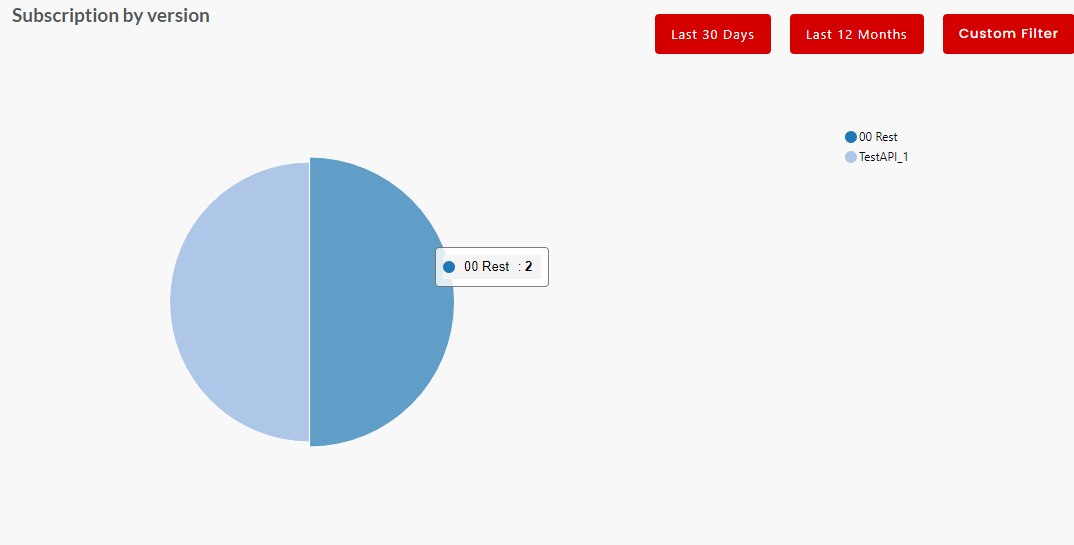
Statistics get updated within a minute of usage except Top selling, Max revenue, and Subscription by version.
Next Steps
In the next section, you will learn how to customise the look and feel of the Publisher portal.