3.30. Search Logs
An application log is a record of the events (user authentication, workflow execution, feature customization etc.) that is logged by the applications used on a system. Application logs help users to find bugs and troubleshoot the application to improve its performance.
DigitMarket™ API Manager allows its users to search and view application logs from the publisher portal. User can enter value or key-value pairs to extract specific data from the listed logs.
To access DigitMarket™ API Manager application logs:
On the main navigation menu, click Search Log. The Search Log page displays.
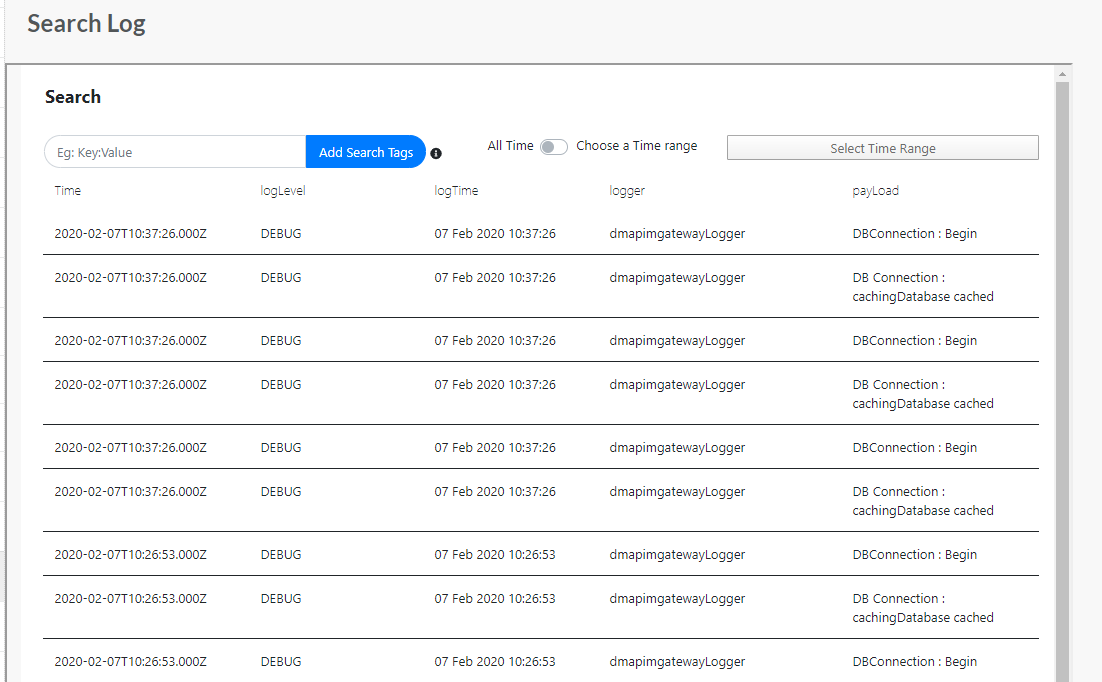
Fig. 3.551 Search Log
In the Search field, enter a value or key-value pair and click Add Search Tags. The search tag is added to the list and the log results are displayed based on the value / key-value pair. The key is the field name displayed in the column headers. Value is the data displayed within the columns. For example,
logLevel:DEBUGis a key-value pair where, key or field name islogLeveland value isDEBUG.
Note
Field name is case sensitive and has the syntax fieldName.
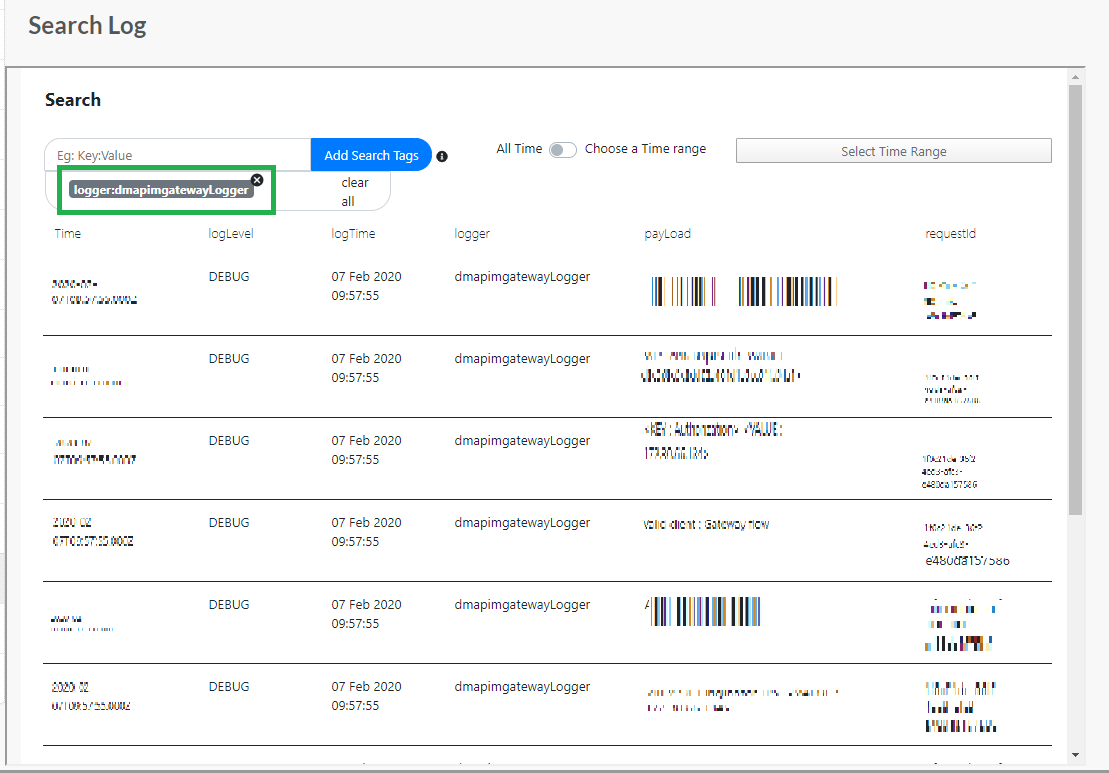
Fig. 3.552 Search Log
To find exact log results, enter the value / key-value pair in double quotes (“ “). Search Log is case-insensitive. But when the search is made with double quotes, the value / key-value pair entered must be case-sensitive.
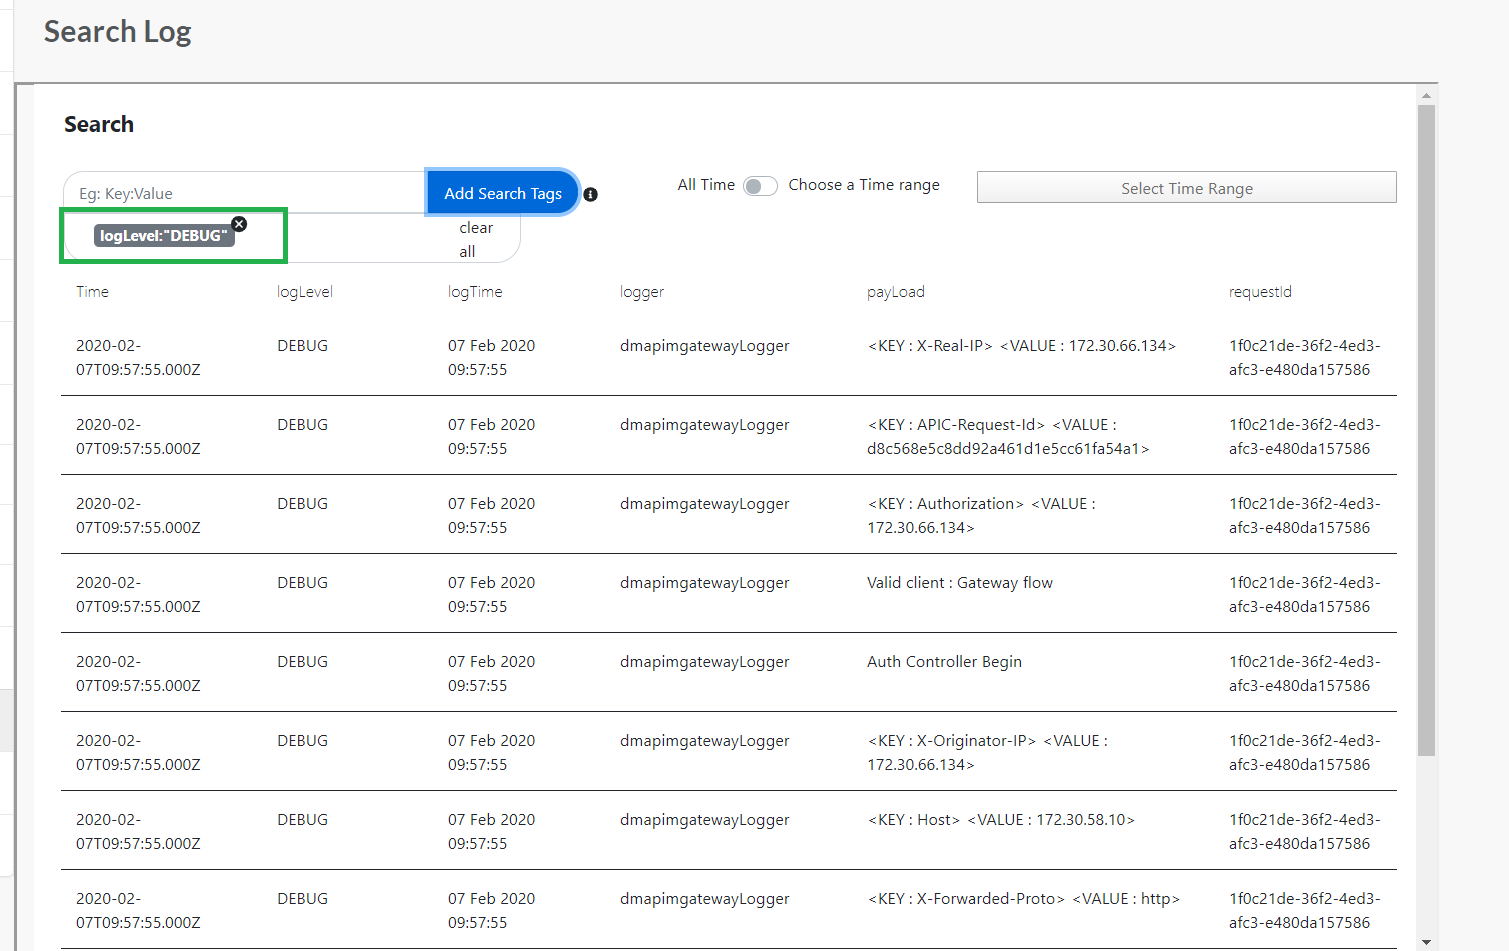
Fig. 3.553 Add to Search
For example, if you want to find the logs with value DBConnection: Begin, in the search field you must enter the search tag as payload:"DBConnection: Begin" to get the exact match results for the log.
(Optional) Hover the mouse pointer over the value and click Add to Search. The Add to Search feature allows you to add the key-value pair as a search tag. The logs will be displayed based on the key-value pair added to the search.
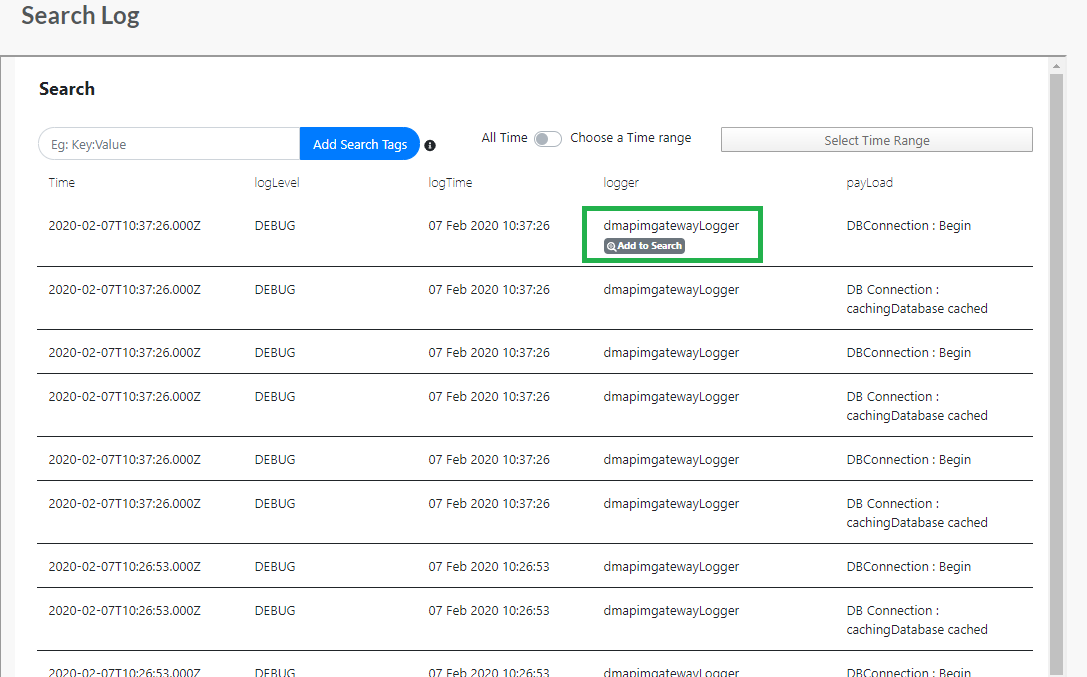
Fig. 3.554 Add to Search
You can also search for all time logs or set a timeline for the searches. This allows you to view logs that have occurred within a specific time range.
To set the time range for log search:
Move the toggler to the right next to Choose a Time range label to enable the Select Time Range button. Inversely, move the toggler to the left next to All time label to view the log results of all time.
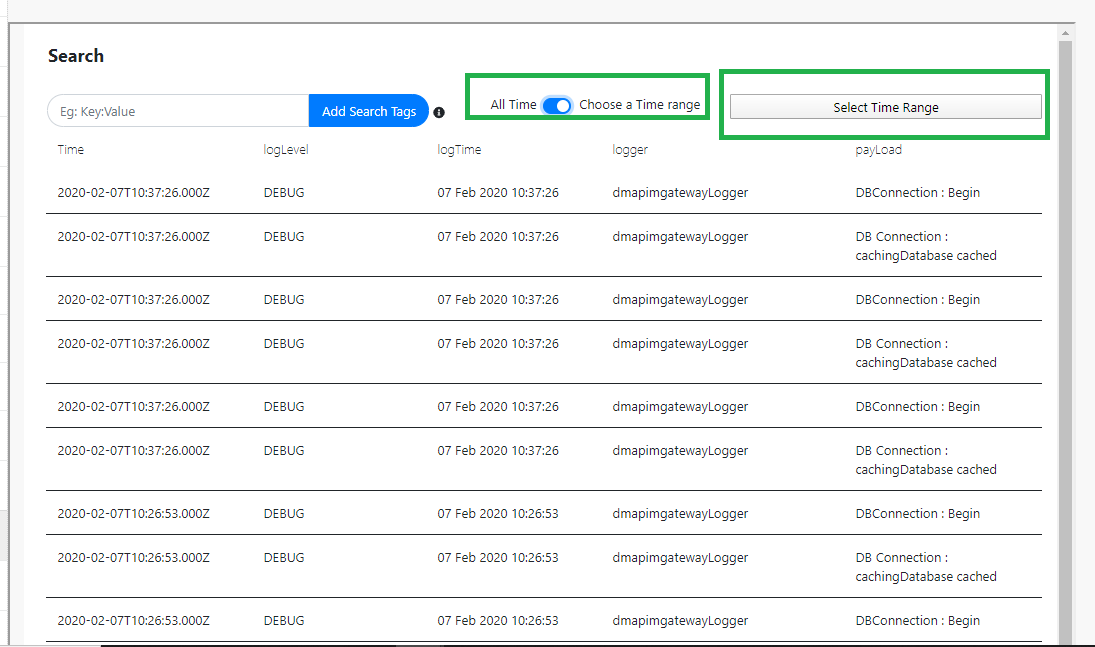
Fig. 3.555 Time Range
Click Select Time Range. The current date displays by default.
To select a time range, click on the required dates on the calendars. Select the ‘From Date’ from the left calendar and select the ‘To Date’ from the right calendar. Similarly, specify the ‘From Time’ and ‘To Time’ in hrs/mins/sec. Use the < and > arrow buttons to navigate between the months.
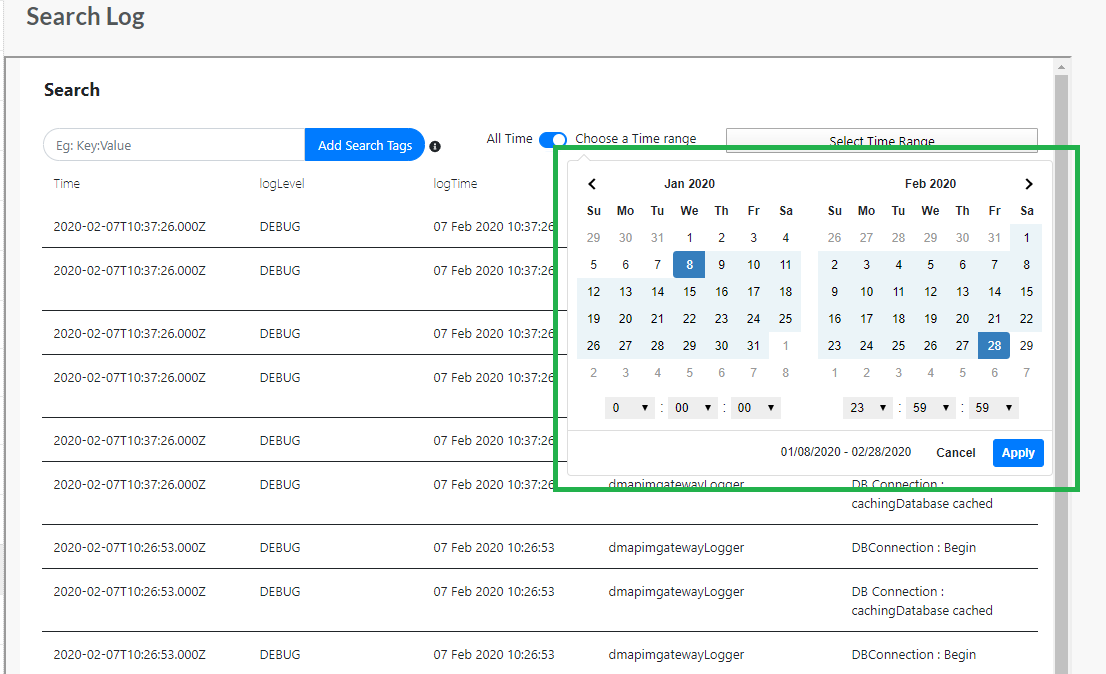
Fig. 3.556 Time Range
After specifying the date and time, click Apply. The application logs for the selected time range is displayed.
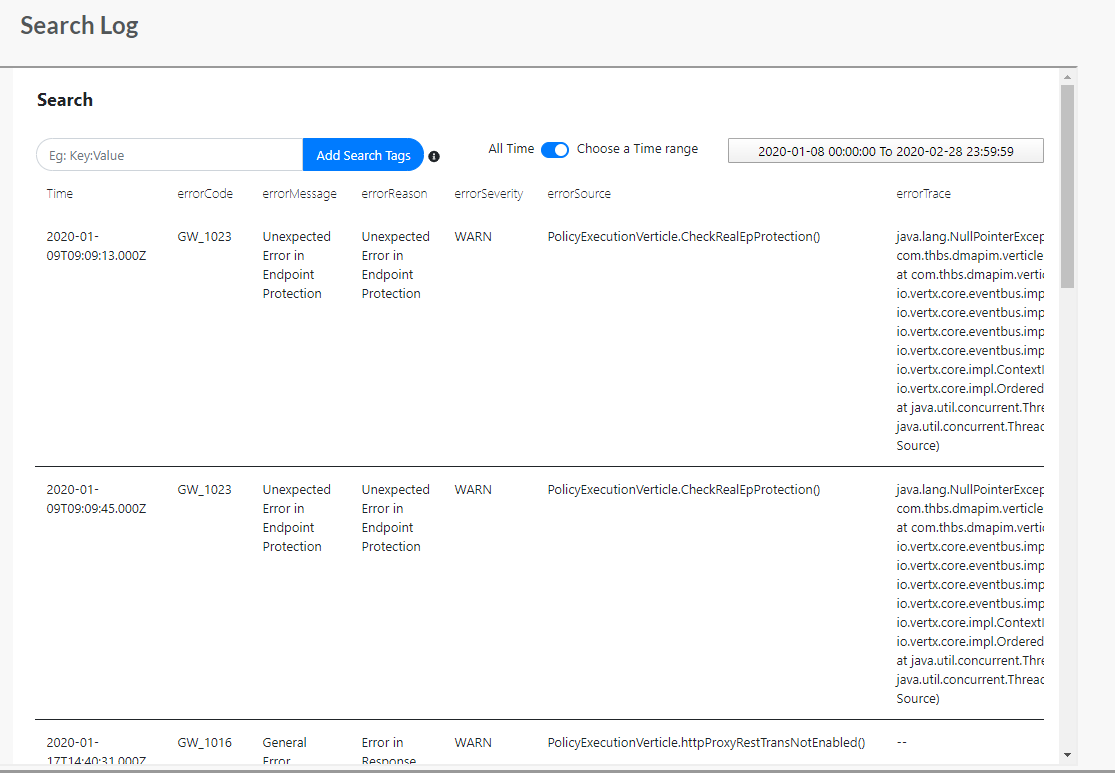
Fig. 3.557 Time Range
Use Previous/Next to switch between the searchlog pages.
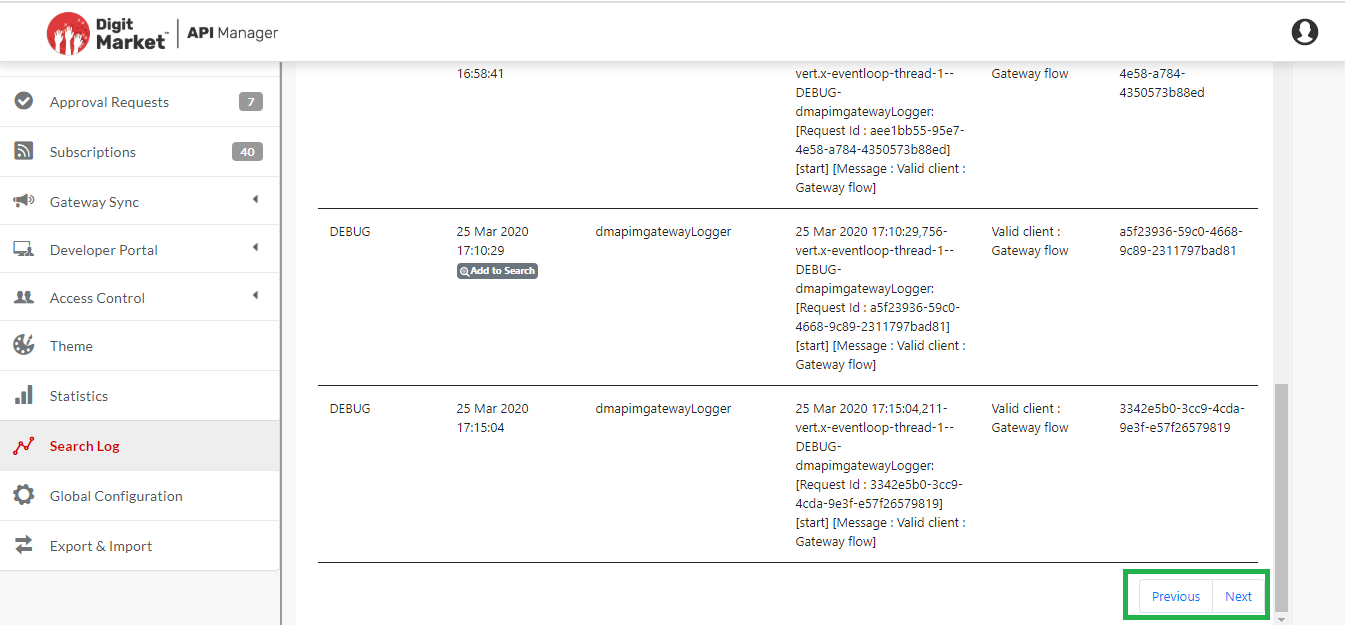
Fig. 3.558 Previous/Next