3.28. Statistics and Analytics
Once the Developer apps go live and start invoking APIs, the API Gateway begins monitoring and collecting data for reporting and analytics. The Statistics also presents real-time streamed analytical information.
Studying the statistical information can provide valuable insights into the popularity and Usage of APIs. Information about how the APIs will be used in the future, and other API-related data and traffic flow enables you to take important business decisions that helps improve profitability of APIs.
Understanding statistical information answers some important questions, such as:
- Who is consuming which APIs?
- What is the traffic generated by top APIs?
- Which APIs brought in the most revenue?
- Which apps generate the most API traffic?
- Was there any API downtime due to errors and timeouts?
To view Statistics:
- In the main Navigation menu, click Statistics. The Statistics screen displays.
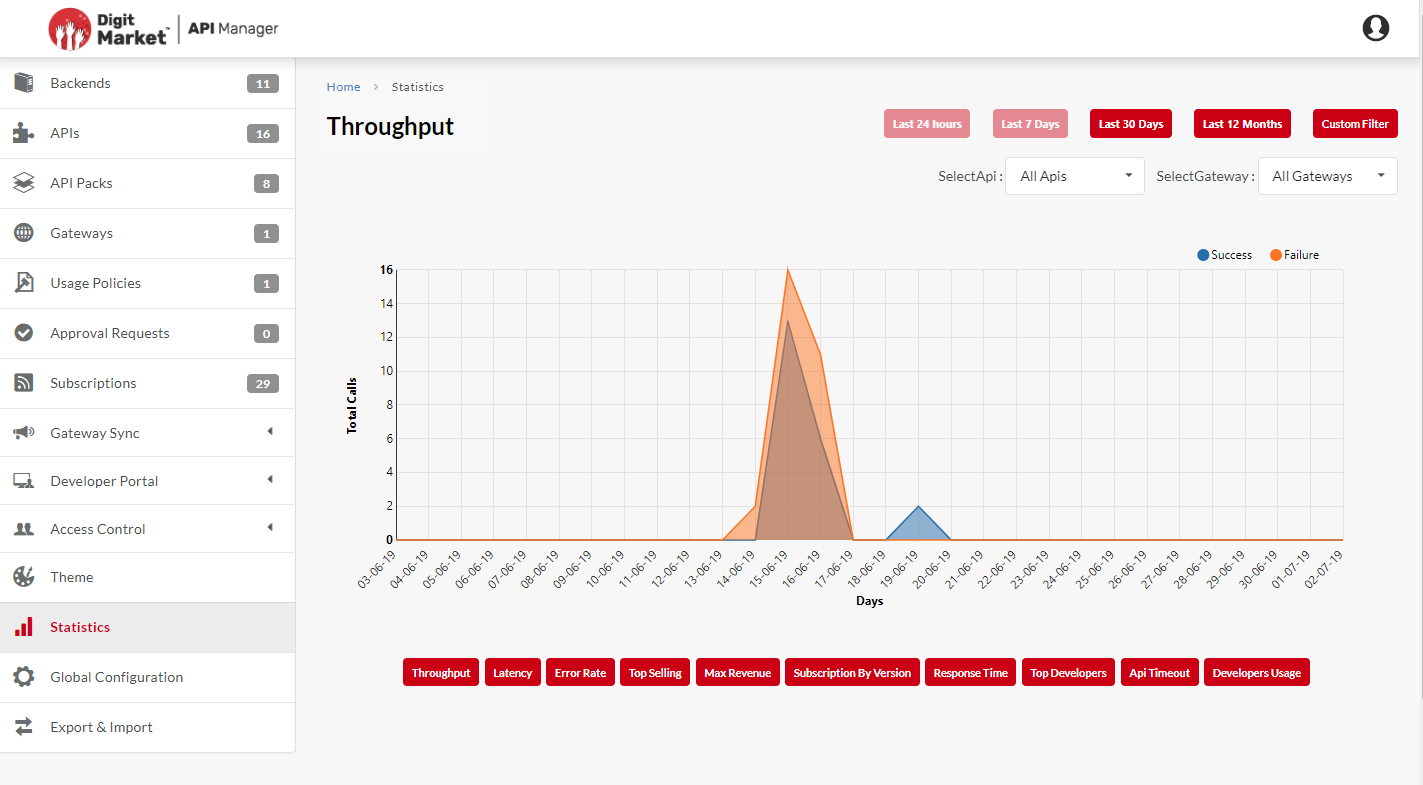
Fig. 3.538 Statistics screen
A collection of icons representing various charts displays. The icon labels and its related information are given below:
Throughput
It is calculated for hours or days for selected APIs and Gateways. The graph is plotted against Total calls Vs Hours.
- Last 24 hours
- Last 7 days
- Last 30 days
- Last 12 months
- Custom filter
- In custom filter user must provide start date and end date and submit, for entered value result will appear.
- Select APIs
- We can select specific API or All APIs.
- Select Gateways
- Select specific Gateways or All.
It is total successful and failure calls during a time period.
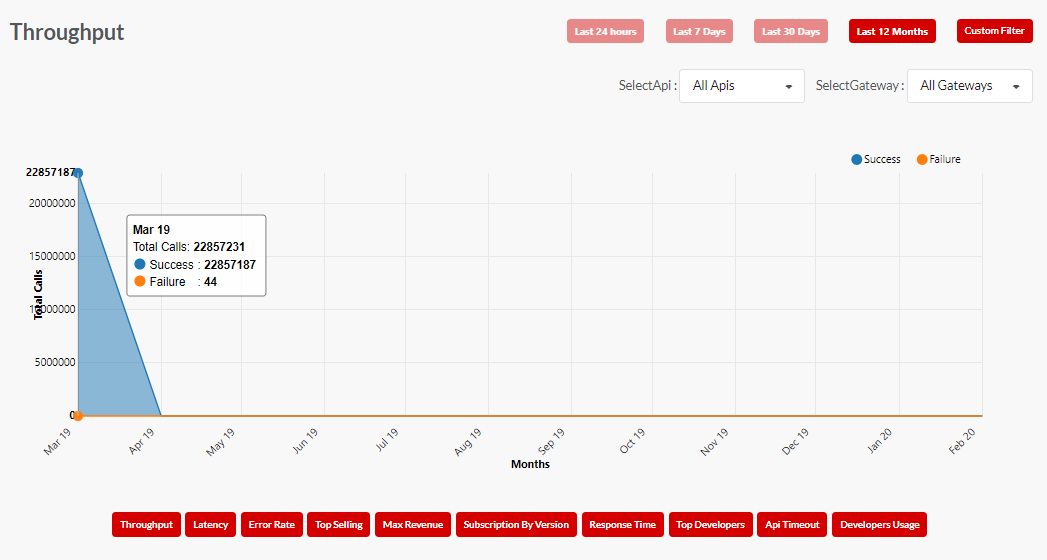
Fig. 3.539 Throughput
Here success rate(successful call of API) is 22857221 Failure rate is 44 which is correspondingly displayed in error rate.
Latency
It is the average response time on API calls (backend) during a period.
It is calculated for hours or days for selected APIs and Gateways. The graph is plotted against Time(ms) Vs Hours.
Last 24 hours
Last 7 days
Last 30 days
Last 12 months
- Custom filter
- In custom filter user must provide start date and end date and submit, for entered value result will appear.
- Select APIs
- We can select specific API or All APIs.
- Select Gateways
- Select specific Gateways or All.
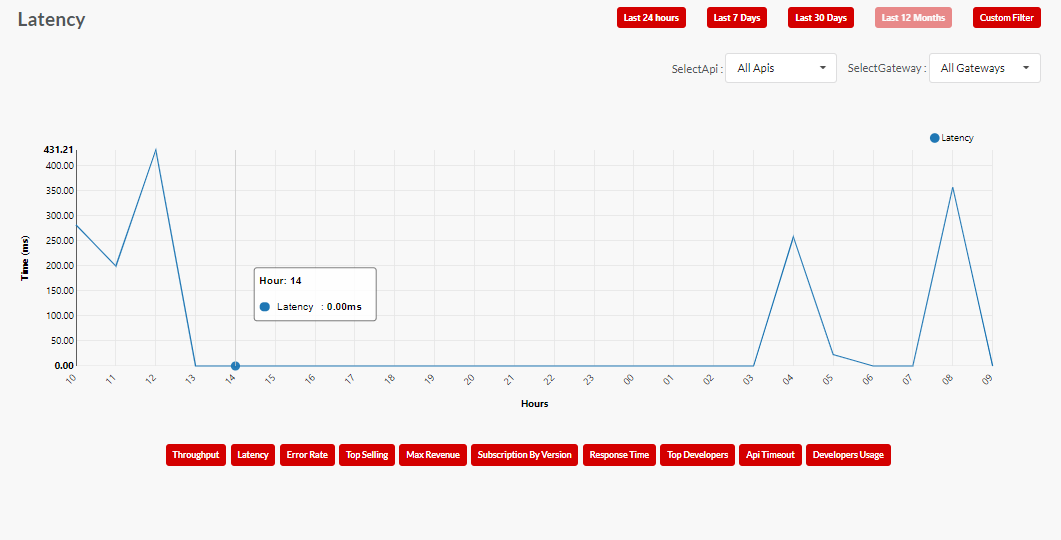
Fig. 3.540 Latency
Error Rate
It is the rate of failure messages generated out of the total messages processed during a time period.
Here failure of API calls is 44% it will change according to the API response
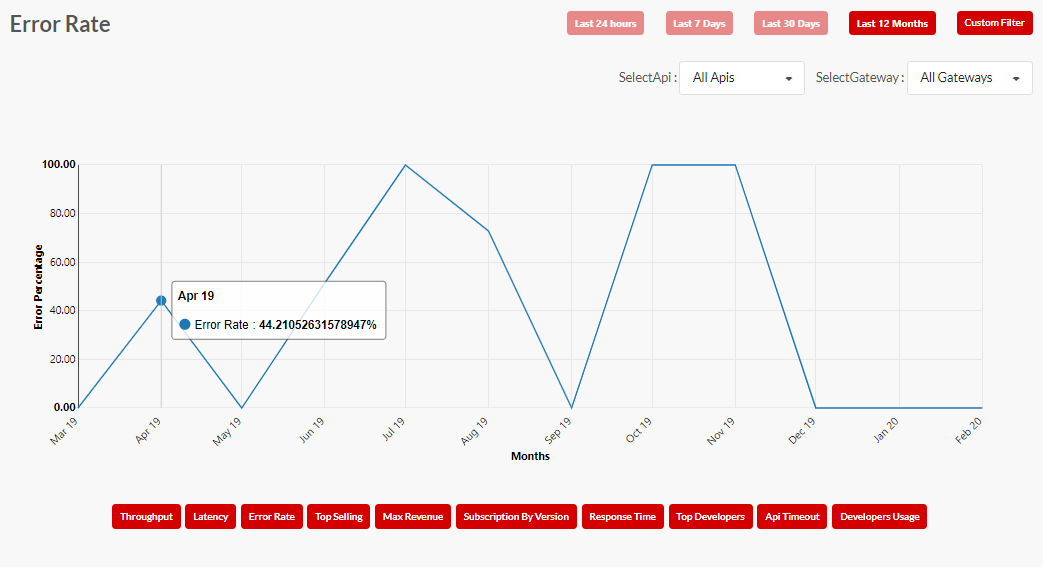
Fig. 3.541 Error_Rate
Top Selling
It is the five most subscribed API Packs.
It is calculated for hours or days for selected APIs and Gateways. The graph is plotted against Number of Subcriptions Vs Hours.
Last 24 hours
Last 7 days
Last 30 days
Last 12 months
- Custom filter
- In custom filter user must provide start date and end date and submit, for entered value result will appear.
- Select APIs
- We can select specific API or All APIs.
- Select Gateways
- Select specific Gateways or All.
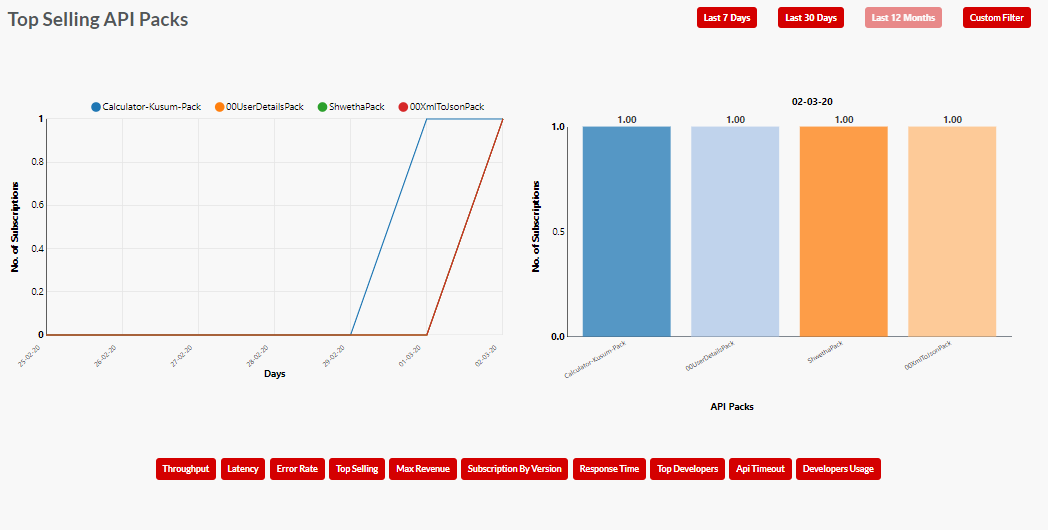
Fig. 3.542 Top_Selling
Maximum Revenue
It is the API Packs that brought in the maximum revenue.
The chart on the righthand side shows on that particular day how many subscriptions had happened.
It is calculated for hours or days.
- Last 24 hours
- Last 7 days
- Last 30 days
- Last 12 months
- Custom filter
- In custom filter user must provide start date and end date and submit, for entered value result will appear.
- Select APIs
- We can select specific API or All APIs.
- Select Gateways
- Select specific Gateways or All.
In custom filter user must provide start date and end date and submit, for entered value result will appear.
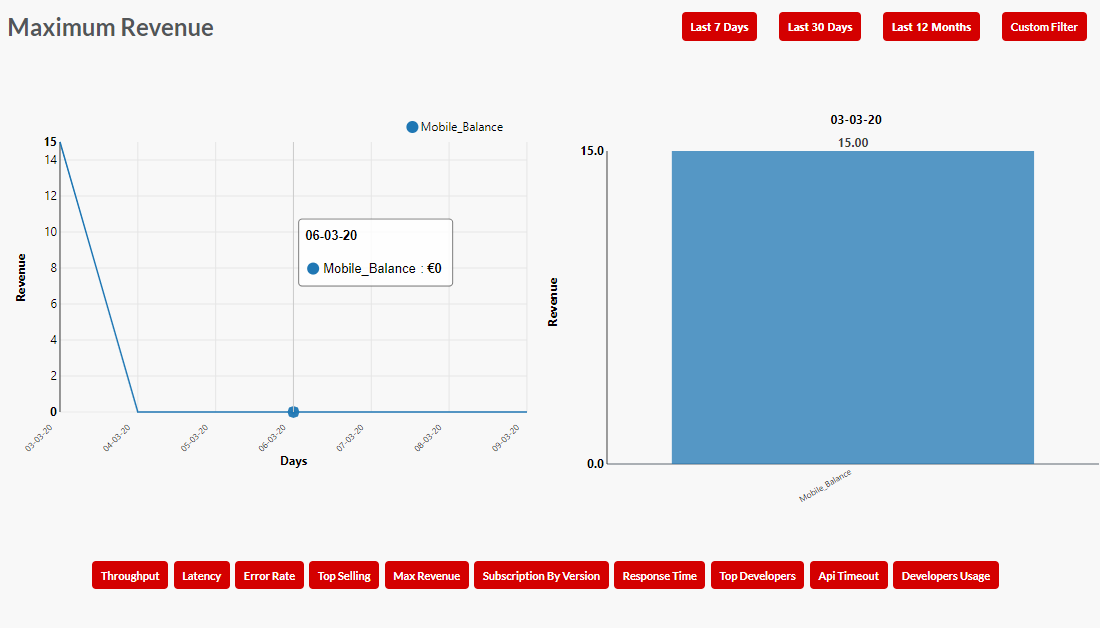
Fig. 3.543 Maximum_Revenue
Subscription By Version
It is the five most subscribed APIs version-wise
It is drawn in Pie Chart. It is calculated for number of days.
- Last 30 days
- Last 12 months
- Custom filter
In custom filter user must provide start date and end date and submit, for entered value result will appear.
Each section in the Pie chart is represented by different colours. Each colour corresponds to each APIs
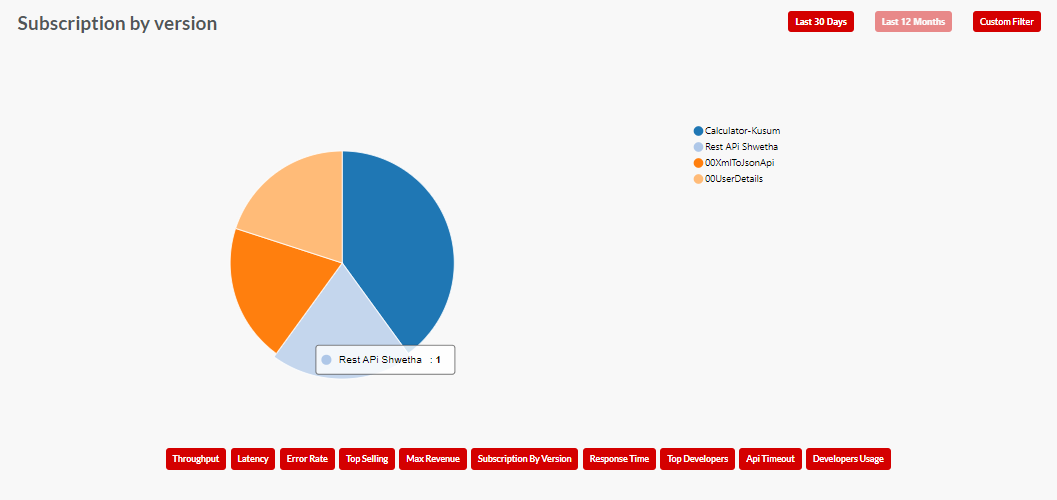
Fig. 3.544 Subscription_By_Version
Response Time
It is the Average response time the APIs receive at different stages of the call. It is calculated for hours or days for selected APIs and Gateways. The graph is plotted against Time(ms) Vs Hours. It is a line chart.
Last 24 hours
Last 7 days
Last 30 days
Last 12 months
- Custom filter
- In custom filter user must provide start date and end date and submit, for entered value result will appear.
- Select APIs
- We can select specific API or All APIs.
- Select Gateways
- Select specific Gateways or All.
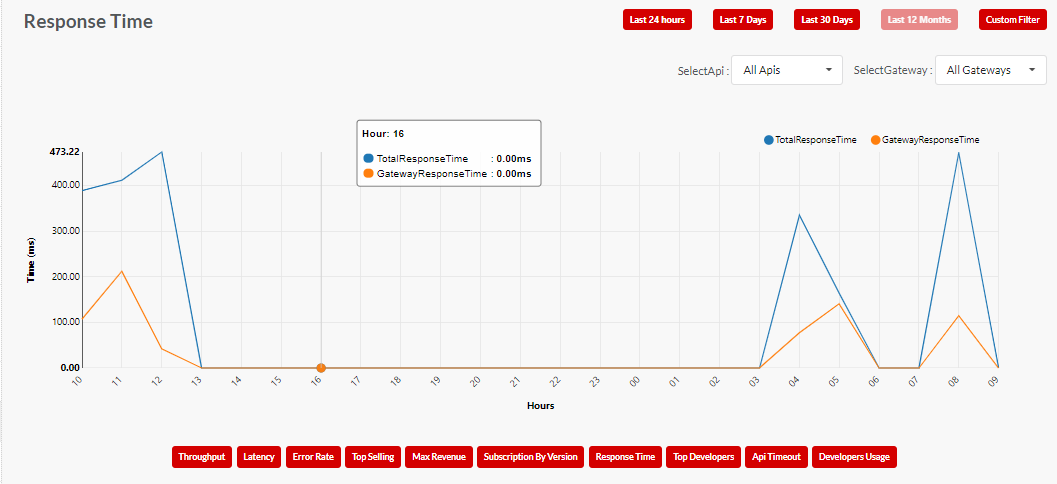
Fig. 3.545 Response_Time
Top Developers
It is the top developers based on total consumption across all APIs.
It is calculated for hours or days for selected APIs and Gateways. The graph is plotted against Apl Usage Vs Top Developers.
Last 30 days
Last 12 months
- Custom filter
- In custom filter user must provide start date and end date and submit, for entered value result will appear.
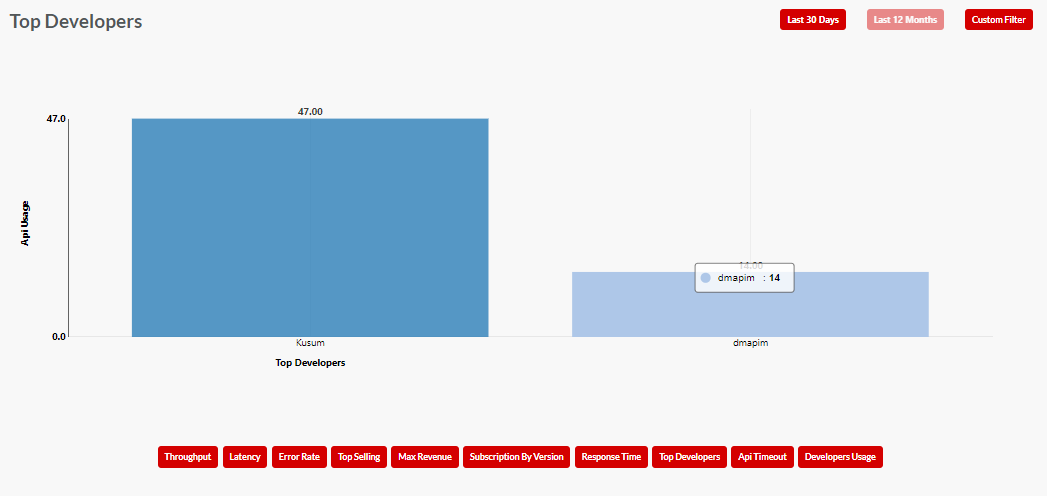
Fig. 3.546 Top_Developers
API Timeout
It is the rate of timeouts during a time period out of the total requests processed. It will generally Zero hence it will display as No Data to Display. It is calculated for hours or days for selected APIs and Gateways. Last 30 days
Last 24 hours
Last 7 days
Last 30 days
Last 12 months
- Custom filter
- In custom filter user must provide start date and end date and submit, for entered value result will appear.
- Select APIs
- We can select specific API or All APIs.
- Select Gateways
- Select specific Gateways or All.
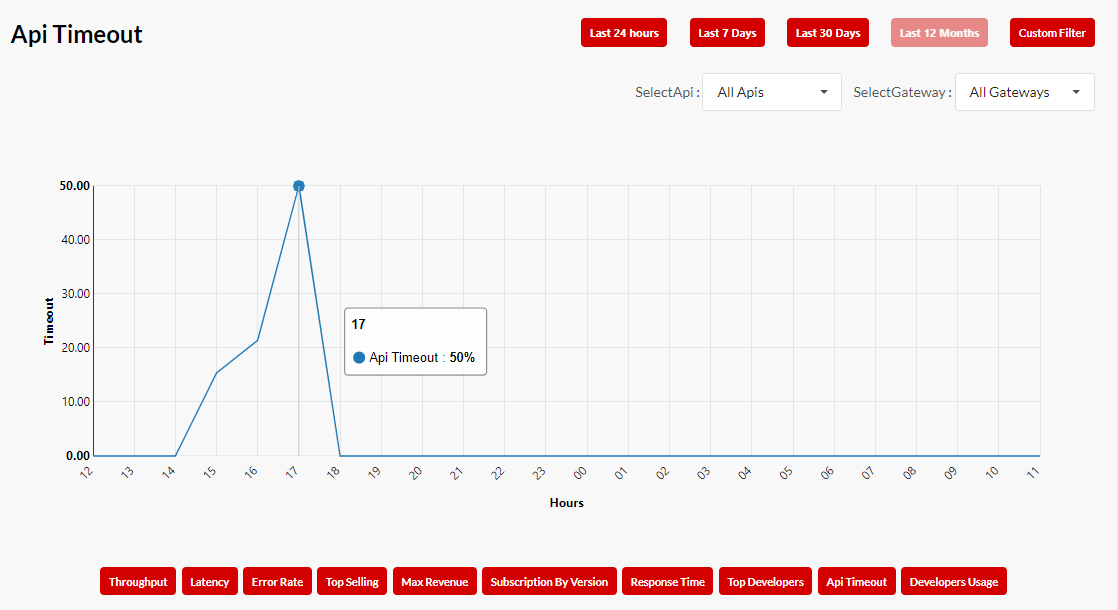
Fig. 3.547 API_Timeout
Developers Usage
It is the API Usage for top developers.
It is calculated for hours or days for selected APIs and Gateways. The graph is plotted against Apl Usage Vs Developers.
Last 24 hours
Last 7 days
Last 30 days
Last 12 months
- Custom filter
- In custom filter user must provide start date and end date and submit, for entered value result will appear.
- Select APIs
- We can select specific API or All APIs.
- Select Gateways
- Select specific Gateways or All.
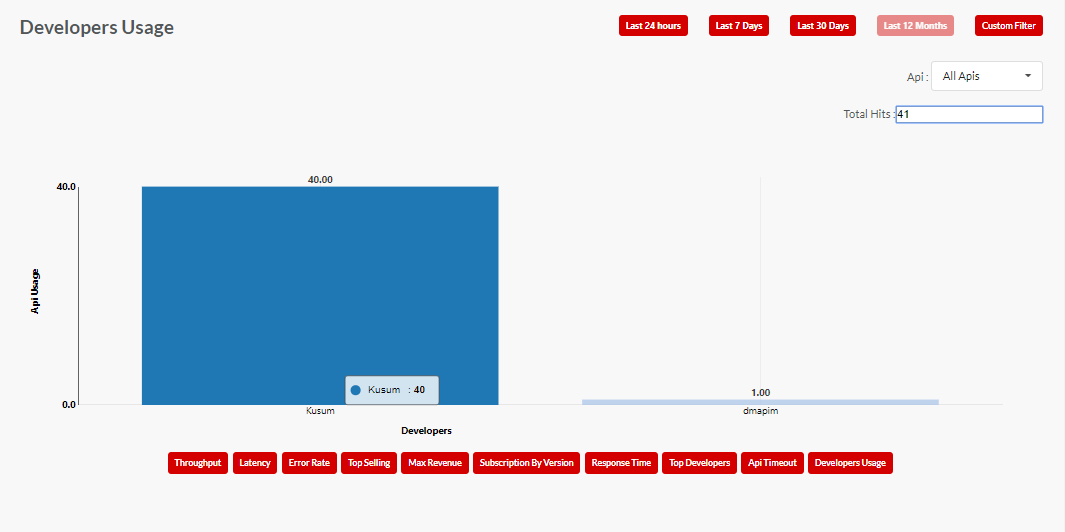
Fig. 3.548 Developers_Usage
Gateway Response and Backend Response Time Consider the scenario If a user is requesting to gateway at time T1 and gateway will pass the request to Backend at time T2, backend will process the request and pass to gateway at time T3 and gateway will pass to user at time T4.
So Total Response Time to User is T4-T1
Back End Response Time is T3-T2
Gateway Response Time is Total Response Time- Backend Response time which is (T4-T1)-(T3-T2)
- Click an icon to view related statistics.
Filter Statistical data
You can filter API data for Throughput, Latency, Error Rate, Response Time, API Timeout and Developers Usage. Filtering data allows you to view statistical report for:
- All APIs
- An individual API
- All Gateways
- An individual Gateway
Additionally, you can use a custom filter option on all screens to display data for a selected period.
Note
Statistics get updated within a minute of usage except Top selling, Max revenue, and Subscription by version.
Next Steps
In the next section, you will learn how to customise the look and feel of the Publisher portal.